|
R + GBIF = rgbif Here is a tutorial for the R package 'rgbif'. This allows you to access specimen information in the Global Biodiversity Information Facility database. GBIF has hundreds of millions of species occurrence records from around the globe, open for anyone to use. How did these records get into GBIF in the first place? The data come from many sources -- various museums, universities, and other institutions. Specimen label data has been recorded and digitized in spreadsheets, and this info is contributed to GBIF. I wrote a script in R to demonstrate how to import records for a desired taxon found in a region, and then I use R functions to display the data.
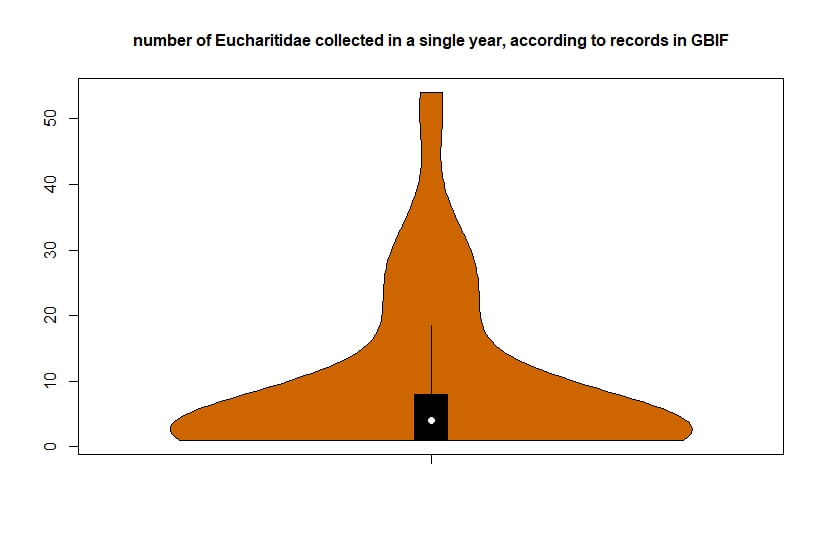
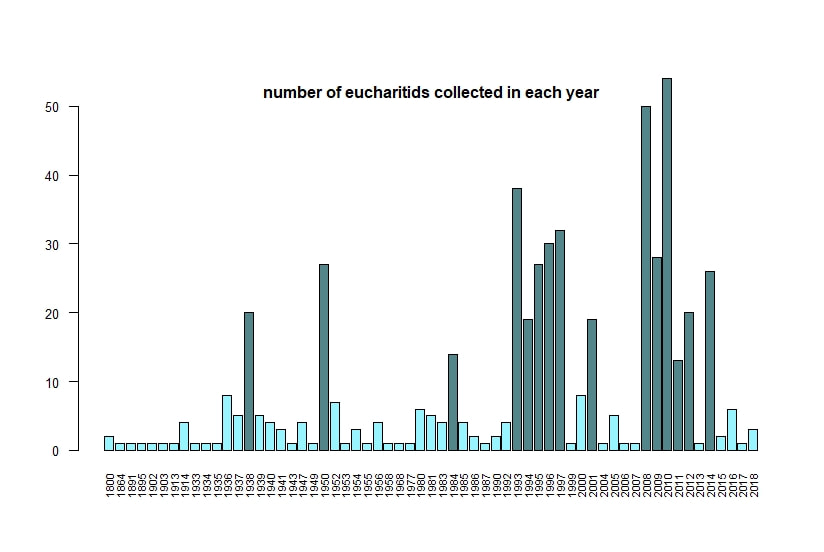
Below I display the number of eucharitid records per year in two different ways. On the left is a violin plot, which I think is a neat way to look at how data are distributed. The width of the violin is relative to the number of yearly records -- not the actual values, but a probability density distribution. The boxplot within shows the median value as a white dot. I excluded zeros here, so we aren't seeing the years where no Eucharitidae were recorded (this keeps the script slightly simpler). On the right is a chronological view of records per year, excluding years with zero records. I've distinguished the years having more than ten records by using a darker bar color.
I enjoyed exploring rgbif and thought it turned into a good introduction to how to plot data from a biodiversity database. I hope you try it out, too! Also, here's another rgbif tutorial I recently found that looks pretty useful; it focuses more on the data manipulation than the data display.
2 Comments
|
PhyloBlogCovering topics of phylogenetics and systematics & other science-related news. Archives
October 2019
Categories
All
|
 RSS Feed