|
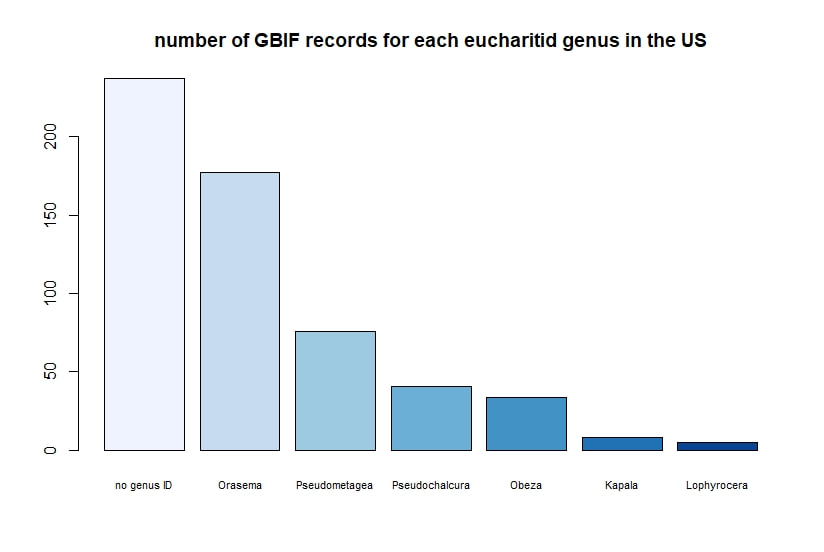
R + GBIF = rgbif Here is a tutorial for the R package 'rgbif'. This allows you to access specimen information in the Global Biodiversity Information Facility database. GBIF has hundreds of millions of species occurrence records from around the globe, open for anyone to use. How did these records get into GBIF in the first place? The data come from many sources -- various museums, universities, and other institutions. Specimen label data has been recorded and digitized in spreadsheets, and this info is contributed to GBIF. I wrote a script in R to demonstrate how to import records for a desired taxon found in a region, and then I use R functions to display the data.
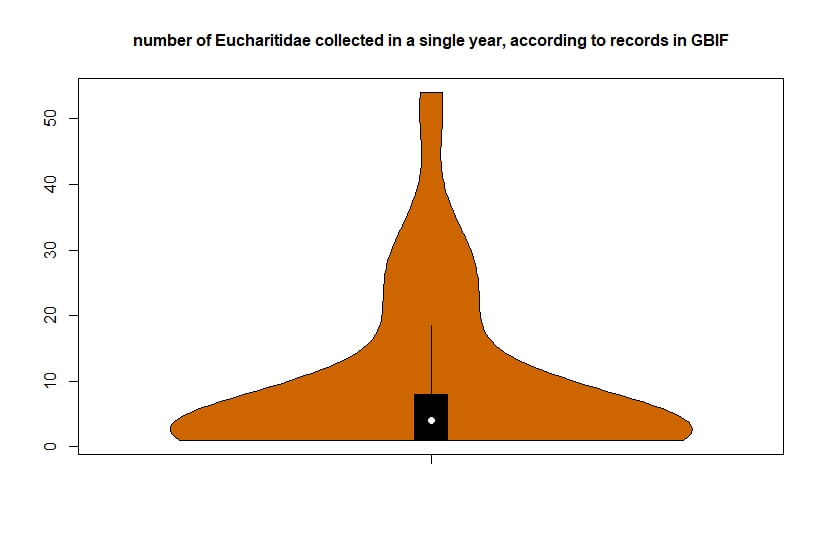
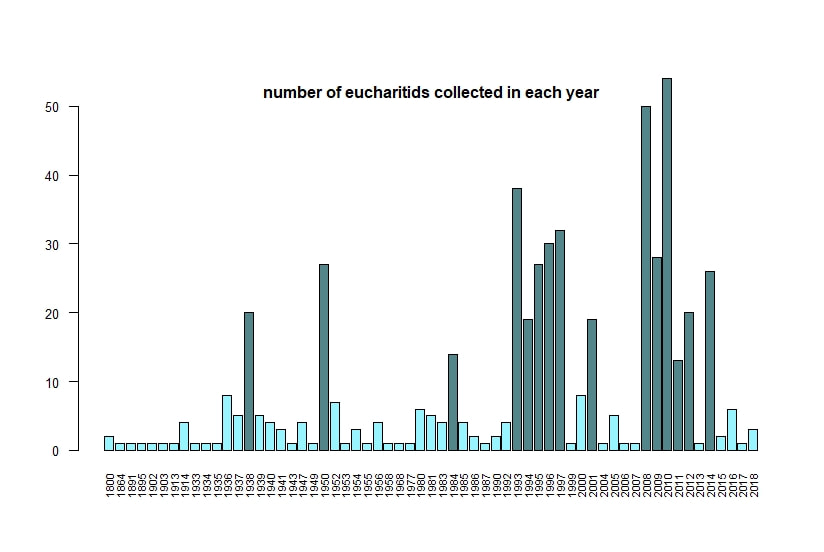
Below I display the number of eucharitid records per year in two different ways. On the left is a violin plot, which I think is a neat way to look at how data are distributed. The width of the violin is relative to the number of yearly records -- not the actual values, but a probability density distribution. The boxplot within shows the median value as a white dot. I excluded zeros here, so we aren't seeing the years where no Eucharitidae were recorded (this keeps the script slightly simpler). On the right is a chronological view of records per year, excluding years with zero records. I've distinguished the years having more than ten records by using a darker bar color.
I enjoyed exploring rgbif and thought it turned into a good introduction to how to plot data from a biodiversity database. I hope you try it out, too! Also, here's another rgbif tutorial I recently found that looks pretty useful; it focuses more on the data manipulation than the data display.
2 Comments
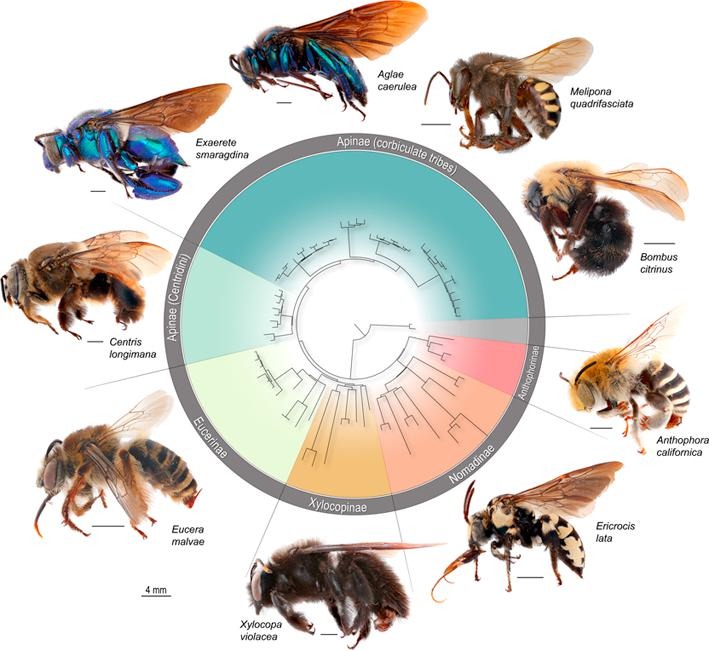
Phylogenomic methods are incredibly popular, and there are various baits and probes for capturing different pieces of the insect genome for analysis. One of the next aspects of 'big data' will be to develop ways to combine all of these sources! My previous post covered a method for visualizing data on tree tips -- specifically I showed a plot of the number of loci recovered after doing a quick combination of genomes, transcriptomes, and UCEs (using the Phyluce pipeline). I'm happy to write that our research paper on the combination of phylogenomic data has been published in Molecular Phylogenetics and Evolution. Bossert et al. 2019 report successful results when three types of datasets are combined for Apidae (the largest bee family). 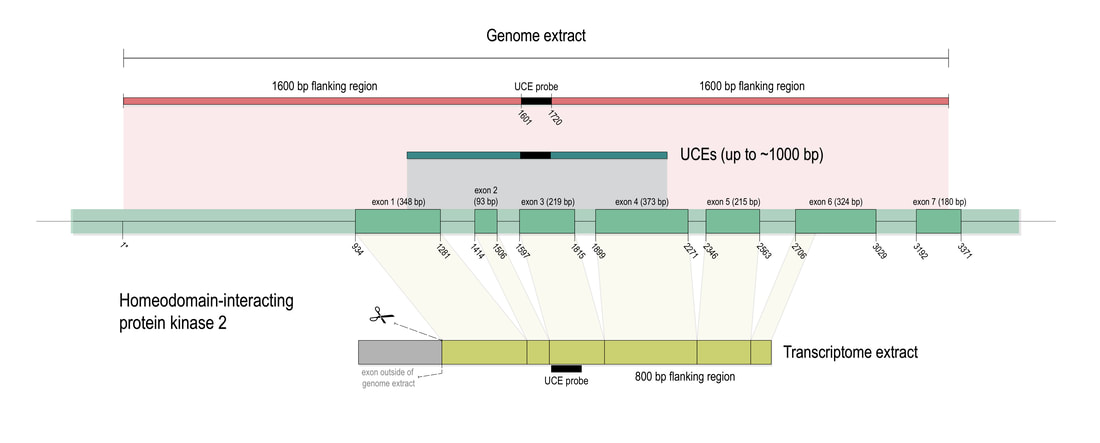 Bossert et al. figure 1. Graphical summary of the workflow developed for combining genome, transcriptome, and UCE data, exemplified for the widely shared HIPK2 gene of the honey bee.
references:
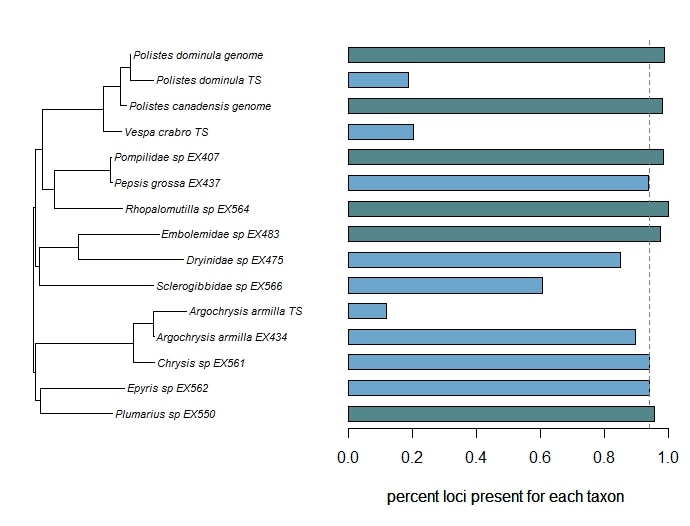
Bossert, S., Murray, E.A., Almeida, E.A.B., Brady, S.G., Blaimer, B.B. & Danforth, B.N. (2019) Combining transcriptomes and ultraconserved elements to illuminate the phylogeny of Apidae. Molecular Phylogenetics and Evolution, 130, 121-131. doi.org/10.1016/j.ympev.2018.10.012 Kieran, T.J., Gordon, E.R., Forthman, M., Hoey-Chamberlain, R., Kimball, R.T., Faircloth, B.C., Weirauch, C. and Glenn, T.C. (2019) Insight from an ultraconserved element bait set designed for Hemipteran phylogenetics integrated with genomic resources. Molecular Phylogenetics and Evolution, 130, 297-303. Phylogenomic datasets can be gappier than matrices concatenated from a small number of hand-selected, Sanger-sequenced genes. Here is a nice way to visualize the percent data coverage and see the distribution of missing data across the tree. I have a dataset of hundreds of loci acquired using ultraconserved element (UCE) probe matching. Besides my own data, there are other types of data that can potentially be incorporated (published genomes, transcriptomes, etc.). I want to see how the topology may be sensitive to different data and parameter permutations. I can use this handy barplot visual for dataset exploration, such as identifying problem clades with low data coverage.
Programs and packages involved in producing this figure:
Load your tree and your data (count data, continuous measurements, etc.) into R, use the handy script from Liam Revell's site, and in short time, you'll have a beautiful and informative figure! references:
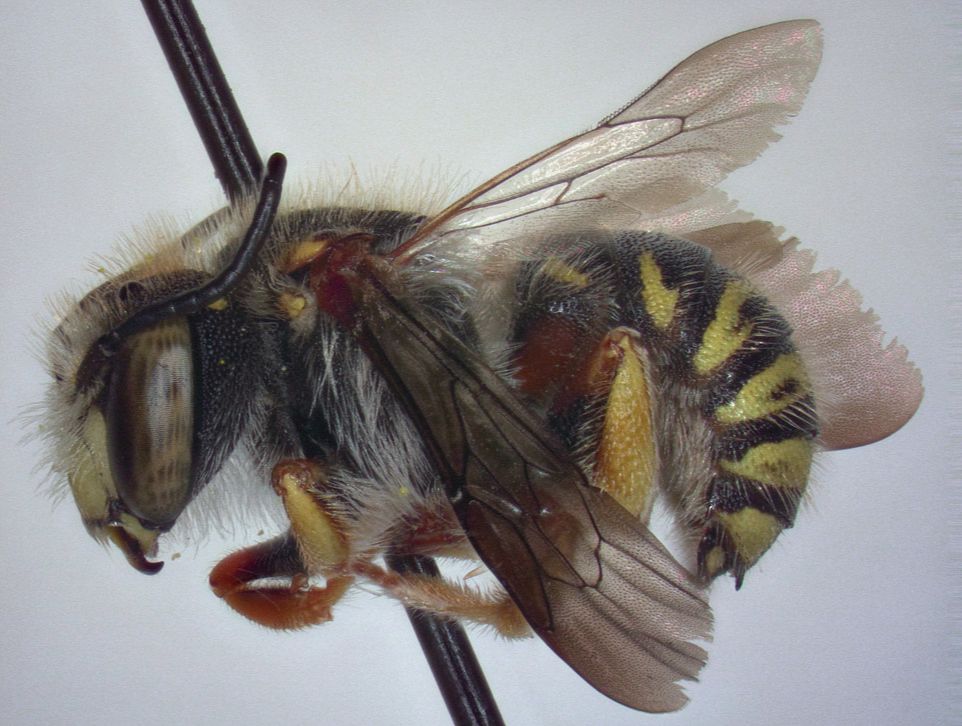
Branstetter, M.G., Danforth, B.N., Pitts, J.P., Faircloth, B.C., Ward, P.S., Buffington, M.L., Gates, M.W., Kula, R.R. & Brady, S.G. (2017) Phylogenomic Insights into the evolution of stinging wasps and the origins of ants and bees. Current Biology, 27, 1019-1025. Branstetter, M.G., Longino, J.T., Ward, P.S. & Faircloth, B.C. (2017) Enriching the ant tree of life: enhanced UCE bait set for genome-scale phylogenetics of ants and other Hymenoptera. Methods in Ecology and Evolution, 8, 768-76. Faircloth, B.C. (2015) PHYLUCE is a software package for the analysis of conserved genomic loci. Bioinformatics, btv646. Lopez-Osorio, F., Pickett, K.M., Carpenter, J.M., Ballif, B.A. & Agnarsson, I. (2017) Phylogenomic analysis of yellowjackets and hornets (Hymenoptera: Vespidae, Vespinae). Molecular Phylogenetics and Evolution, 107, 10-15. Use the free photo processing program, Fiji, to make a gif out of your stack of z-stepped images! You'll produce a nice little video clip that scrolls through all of the layered shots that you've taken of your specimen.
make a gif using ImageJ and your stack of images:
Setting a starting tree in the program BEAST can be a complicated issue, and I've been asked about troubleshooting for it. Here is a full XML file with annotations, as an example of how to designate a starting tree and how to force BEAST to keep it as a fixed topology. BEAST is a widely-used phylogenetic dating program and has an excellent GUI interface in BEAUti, where users can control most all parameters and inputs they'd need. BEAUti is the front-end program that produces the XML file that is then used by BEAST for tree estimation. XML stands for 'eXtensible Markup Language', which is both human and machine readable, and is similar to HTML. One piece that must be manually edited in a text editor is the user-specified starting tree, if desired. Why use a starting tree? For large and difficult datasets, one can start in the best area of parameter space, so that the Markov chain isn't wasting time jumping around to sample the presumably 'incorrect' topologies. I'm not sure as to how much a starting tree increases efficiency, since alternate topologies can still be sampled (it's certainly not needed for small, straightforward datasets), but I may update my opinions in the future based on the success of trying to manipulate phylogenomic data. There are two different XML editing tasks I'll cover.
Setting a user-specified starting topology The default starting tree is a random tree, which is coded in an element (content & attributes surrounded by an opening and closing tag ('init', our tree initializer). The whole element needs to be replaced by a user-specified starting tree in newick format. Take a look at the example document! Fixing the starting tree topology There are four lines to comment out: the operators for subtree-slide, wide & narrow exchange, and Wilson-Balding. Removing these four operators prevents the topology from updating, but still allows for estimation of the node ages (i.e., branch lengths will be modified even though the topology will not). In an XML file, comments are surrounded by ' <!-- ' and ' --> ', which means they will not be processed.
There are a couple of nice sites with information on user input starting trees, yet translating that to your own data can still be a bit of a struggle. I hope here I could add a bit of guidance on the issue by providing an annotated XML file to help clarify the changes needed.
There is now an updated and more-detailed tutorial at: http://www.beast2.org/fix-starting-tree/. Also, thanks to great info from: http://www.northernbotanist.com/?page_id=732. |
PhyloBlogCovering topics of phylogenetics and systematics & other science-related news. Archives
October 2019
Categories
All
|
|||||||||||||||||||||
 RSS Feed