|
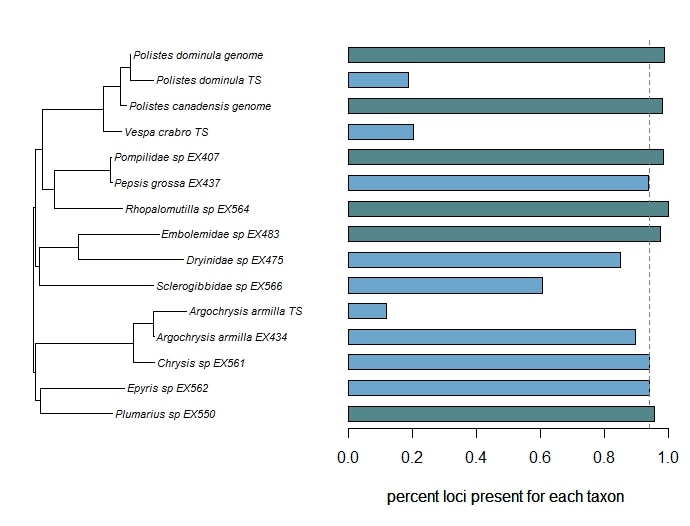
Phylogenomic datasets can be gappier than matrices concatenated from a small number of hand-selected, Sanger-sequenced genes. Here is a nice way to visualize the percent data coverage and see the distribution of missing data across the tree. I have a dataset of hundreds of loci acquired using ultraconserved element (UCE) probe matching. Besides my own data, there are other types of data that can potentially be incorporated (published genomes, transcriptomes, etc.). I want to see how the topology may be sensitive to different data and parameter permutations. I can use this handy barplot visual for dataset exploration, such as identifying problem clades with low data coverage.
Programs and packages involved in producing this figure:
Load your tree and your data (count data, continuous measurements, etc.) into R, use the handy script from Liam Revell's site, and in short time, you'll have a beautiful and informative figure! references:
Branstetter, M.G., Danforth, B.N., Pitts, J.P., Faircloth, B.C., Ward, P.S., Buffington, M.L., Gates, M.W., Kula, R.R. & Brady, S.G. (2017) Phylogenomic Insights into the evolution of stinging wasps and the origins of ants and bees. Current Biology, 27, 1019-1025. Branstetter, M.G., Longino, J.T., Ward, P.S. & Faircloth, B.C. (2017) Enriching the ant tree of life: enhanced UCE bait set for genome-scale phylogenetics of ants and other Hymenoptera. Methods in Ecology and Evolution, 8, 768-76. Faircloth, B.C. (2015) PHYLUCE is a software package for the analysis of conserved genomic loci. Bioinformatics, btv646. Lopez-Osorio, F., Pickett, K.M., Carpenter, J.M., Ballif, B.A. & Agnarsson, I. (2017) Phylogenomic analysis of yellowjackets and hornets (Hymenoptera: Vespidae, Vespinae). Molecular Phylogenetics and Evolution, 107, 10-15.
0 Comments
Your comment will be posted after it is approved.
Leave a Reply. |
PhyloBlogCovering topics of phylogenetics and systematics & other science-related news. Archives
October 2019
Categories
All
|
 RSS Feed