Elizabeth Murray
  • home
  • research
    • phylogenomics in Aculeata
    • bee viruses
    • eucharitid ant parasitoids
  • publications
  • teaching
  • blog

Visualizing data -- matrix completeness

9/26/2018

0 Comments

 
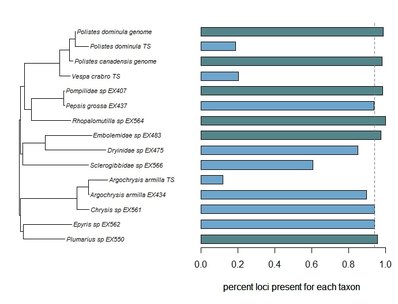
Phylogenomic datasets can be gappier than matrices concatenated from a small number of hand-selected, Sanger-sequenced genes. Here is a nice way to visualize the percent data coverage and see the distribution of missing data across the tree. 
I have a dataset of hundreds of loci acquired using ultraconserved element (UCE) probe matching. Besides my own data, there are other types of data that can potentially be incorporated (published genomes, transcriptomes, etc.). I want to see how the topology may be sensitive to different data and parameter permutations. I can use this handy barplot visual for dataset exploration, such as identifying problem clades with low data coverage. 
Picture
A phylogeny of some aculeates with the percent of the loci present in the data matrix. Genomes are labeled, TS = transcriptomes, and EX#s are UCEs. The dashed line is the median value of loci completeness. Taxa above the median have green bars, and those below have blue.
To make the figure to the right: import your tree & data into R and adapt this phytools script. 
In the tree shown at left, I've included data from genomes, transcriptomes ('TS'), & UCE probes matched in vitro to DNA extracts ('EX') (data in Dryad; Branstetter et al. 2017a). Full genomes should theoretically match all UCE probes, and we are recovering these genome-based taxa at 98-100% completeness, dependent on parameters in phyluce. Using default matching settings, our UCE probes match to transcriptomes (data in Dryad; Lopez-Osorio et al. 2017) at a low rate, which seems to cause artificially long terminal branches in this case.
Programs and packages involved in producing this figure:
  • I used the Hym-v2 probe set (Dryad; Branstetter et al. 2017b) to match UCE probes to published assemblies. The assemblies with an 'EX' in the name are from Branstetter et al. 2017. All probe-matching and matrix-building was done using phyluce. I used RAxML (on CIPRES) to build a concatenated phylogeny from >400 genes (the tree shown is pruned from >100 taxa). 
  • I discovered last year that Windows 10 users can click a box to install the Bash shell for Ubuntu (a beta version) and thereby use Linux command-line tools. I used some functions in Linux to build the gene completeness data, since I haven't seen a different way to calculate this. I sometimes end up doing 'MacGyver Scripting' (TM).  It gets the job done, but is not the most elegant. I used the Linux function 'awk' to record the names of all taxa in each individual locus alignment file and then counted the occurrences of each to output a sorted table of the number of loci for each taxon. I could've put this directly into R, but I opened it in Excel and converted the number of loci to a percent, based on the taxon with highest number of loci set at 100% (which was conveniently first on the list). This is the data table I loaded into R.
  • PLOTTING: From there, I was going to use the ggtree facet_plot function to display the phylogeny and data completeness. But I found something that seemed even better (and was less of a struggle than getting ggtree dependencies to work) -- a script that on Liam Revell's blog for the phytools function plotTree.barplot. I removed the argument for converting the data to log scale and tweaked a few small things. I like that the median value is marked on the graph, too. 
Load your tree and your data (count data, continuous measurements, etc.) into R, use the handy script from Liam Revell's site, and in short time, you'll have a beautiful and informative figure!
references:
Branstetter, M.G., Danforth, B.N., Pitts, J.P., Faircloth, B.C., Ward, P.S., Buffington, M.L., Gates, M.W., Kula, R.R. & Brady, S.G. (2017) Phylogenomic Insights into the evolution of stinging wasps and the origins of ants and bees. Current Biology, 27, 1019-1025.
Branstetter, M.G., Longino, J.T., Ward, P.S. & Faircloth, B.C. (2017) Enriching the ant tree of life: enhanced UCE bait set for genome-scale phylogenetics of ants and other Hymenoptera. Methods in Ecology and Evolution, 8, 768-76.
Faircloth, B.C. (2015) PHYLUCE is a software package for the analysis of conserved genomic loci. Bioinformatics, btv646.
Lopez-Osorio, F., Pickett, K.M., Carpenter, J.M., Ballif, B.A. & Agnarsson, I. (2017) Phylogenomic analysis of yellowjackets and hornets (Hymenoptera: Vespidae, Vespinae). Molecular Phylogenetics and Evolution, 107, 10-15.
0 Comments

    PhyloBlog

    Covering topics of phylogenetics and systematics & other science-related news.

    Archives

    October 2019
    June 2019
    March 2019
    November 2018
    October 2018
    September 2018
    December 2017
    November 2017
    October 2017
    September 2017
    August 2017
    July 2017
    June 2017
    May 2017
    April 2017
    March 2017
    February 2017
    January 2017
    December 2016

    Categories

    All
    History & Context
    Programs & Packages
    Taxonomy & Morphology

    RSS Feed

Elizabeth A. Murray, ​PHYLOGENETICS AND EVOLUTION of Hymenoptera

@PhyloSolving  |  e.murray @ wsu.edu
  • home
  • research
    • phylogenomics in Aculeata
    • bee viruses
    • eucharitid ant parasitoids
  • publications
  • teaching
  • blog