Elizabeth Murray
  • home
  • research
    • aculeate UCE project
    • bee viruses
    • eucharitid ant parasitoids
  • publications
  • teaching
  • blog

Visualizing data -- matrix completeness

9/26/2018

0 Comments

 
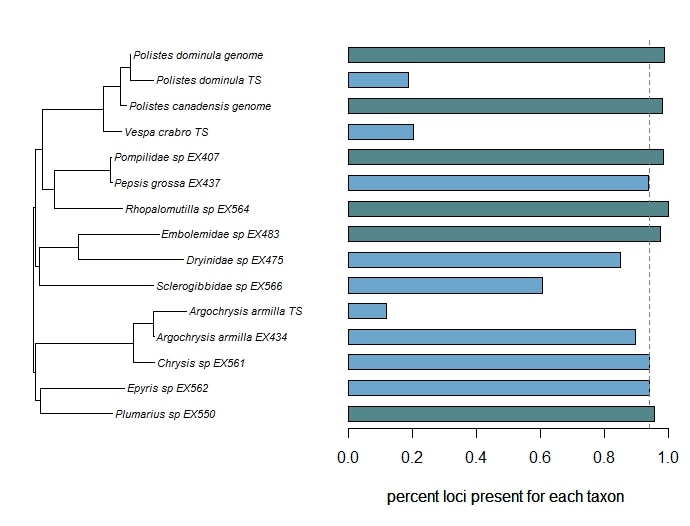
Phylogenomic datasets can be gappier than matrices concatenated from a small number of hand-selected, Sanger-sequenced genes. Here is a nice way to visualize the percent data coverage and see the distribution of missing data across the tree. 
I have a dataset of hundreds of loci acquired using ultraconserved element (UCE) probe matching. Besides my own data, there are other types of data that can potentially be incorporated (published genomes, transcriptomes, etc.). I want to see how the topology may be sensitive to different data and parameter permutations. I can use this handy barplot visual for dataset exploration, such as identifying problem clades with low data coverage. 
Picture
A phylogeny of some aculeates with the percent of the loci present in the data matrix. Genomes are labeled, TS = transcriptomes, and EX#s are UCEs. The dashed line is the median value of loci completeness. Taxa above the median have green bars, and those below have blue.
To make the figure to the right: import your tree & data into R and adapt this phytools script. 
In the tree shown at left, I've included data from genomes, transcriptomes ('TS'), & UCE probes matched in vitro to DNA extracts ('EX') (data in Dryad; Branstetter et al. 2017a). Full genomes should theoretically match all UCE probes, and we are recovering these genome-based taxa at 98-100% completeness, dependent on parameters in phyluce. Using default matching settings, our UCE probes match to transcriptomes (data in Dryad; Lopez-Osorio et al. 2017) at a low rate, which seems to cause artificially long terminal branches in this case.
Programs and packages involved in producing this figure:
  • I used the Hym-v2 probe set (Dryad; Branstetter et al. 2017b) to match UCE probes to published assemblies. The assemblies with an 'EX' in the name are from Branstetter et al. 2017. All probe-matching and matrix-building was done using phyluce. I used RAxML (on CIPRES) to build a concatenated phylogeny from >400 genes (the tree shown is pruned from >100 taxa). 
  • I discovered last year that Windows 10 users can click a box to install the Bash shell for Ubuntu (a beta version) and thereby use Linux command-line tools. I used some functions in Linux to build the gene completeness data, since I haven't seen a different way to calculate this. I sometimes end up doing 'MacGyver Scripting' (TM).  It gets the job done, but is not the most elegant. I used the Linux function 'awk' to record the names of all taxa in each individual locus alignment file and then counted the occurrences of each to output a sorted table of the number of loci for each taxon. I could've put this directly into R, but I opened it in Excel and converted the number of loci to a percent, based on the taxon with highest number of loci set at 100% (which was conveniently first on the list). This is the data table I loaded into R.
  • PLOTTING: From there, I was going to use the ggtree facet_plot function to display the phylogeny and data completeness. But I found something that seemed even better (and was less of a struggle than getting ggtree dependencies to work) -- a script that on Liam Revell's blog for the phytools function plotTree.barplot. I removed the argument for converting the data to log scale and tweaked a few small things. I like that the median value is marked on the graph, too. 
Load your tree and your data (count data, continuous measurements, etc.) into R, use the handy script from Liam Revell's site, and in short time, you'll have a beautiful and informative figure!
references:
Branstetter, M.G., Danforth, B.N., Pitts, J.P., Faircloth, B.C., Ward, P.S., Buffington, M.L., Gates, M.W., Kula, R.R. & Brady, S.G. (2017) Phylogenomic Insights into the evolution of stinging wasps and the origins of ants and bees. Current Biology, 27, 1019-1025.
Branstetter, M.G., Longino, J.T., Ward, P.S. & Faircloth, B.C. (2017) Enriching the ant tree of life: enhanced UCE bait set for genome-scale phylogenetics of ants and other Hymenoptera. Methods in Ecology and Evolution, 8, 768-76.
Faircloth, B.C. (2015) PHYLUCE is a software package for the analysis of conserved genomic loci. Bioinformatics, btv646.
Lopez-Osorio, F., Pickett, K.M., Carpenter, J.M., Ballif, B.A. & Agnarsson, I. (2017) Phylogenomic analysis of yellowjackets and hornets (Hymenoptera: Vespidae, Vespinae). Molecular Phylogenetics and Evolution, 107, 10-15.
0 Comments

A wasp by any other name

12/31/2017

0 Comments

 
Do you love talking about wasps? Here's how you pronounce the word 'hornet' in dozens of languages!
Picture
Pronunciations of wasp and hornet in various languages. Edwards 1980, Table 1.
Wondering how to say 'wasp' and 'hornet' in 32 languages? Well, me neither, really! But here it is. 

This table of information struck me as a bit of an unconventional choice for a book on social wasps, but it's interesting. 

It's easy to see the translation of Latin and Greek to the names of wasp genera, such as Sphex, Vespa, and Crabro.
References:
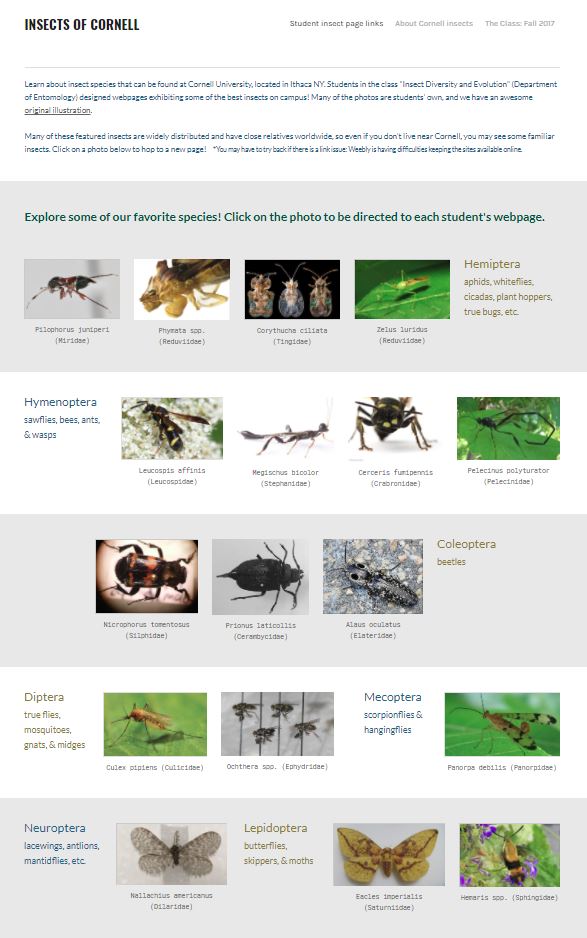
Edwards, R. (1980). Social wasps. Their biology and control. Rentokil Ltd.
0 Comments

Student webpages: Insects of Cornell

11/30/2017

0 Comments

 
For the course I'm teaching this fall (Insect Diversity and Evolution, ENTOM 3310/3311), the students each designed a webpage on their favorite species of insect that could be found at Cornell. Check it out!
Picture
The unifying theme is “Insects of Cornell” (insectsofcornell.weebly.com), and each student picked an insect that could be found here in our region and then designed a page around it, all of which are accessed via photo links from the central class page. Some students used insects they had collected for the lab portion of the class. Many of them used original photos.

The students chose a target audience for our site and learned about some basic website design guidelines. In the site development process, they went through a peer review of each other’s site design and content and learned a bit about website analytics. Also, we visited the Cornell University Insect Collection to find our individual species in the collections and to add a collection-based fact to the sites.
We used the free Weebly for Education platform. None of the students had made their own website prior to this semester & overall, it seemed like the students caught on quickly. The biggest problem I encountered is that the individual sites are often down. Clicking on the link gives a message: "This page isn't working" -- which is an issue on the Weebly end. That's a little disappointing, and I hope it improves.
0 Comments

Animate stacks of images in ImageJ

10/29/2017

0 Comments

 
Use the free photo processing program, Fiji, to make a gif out of your stack of z-stepped images! You'll produce a nice little video clip that scrolls through all of the layered shots that you've taken of your specimen.
The images were taken on a Zeiss Stemi SV 6 microscope with an Axiocam 105 color camera. There are a total of 56 images. We don't have an automatic z-stepper for taking stacks of images, but we manually roll the focus knob to capture each of the 56 shots. 
Thanks to my labmate, Silas Bossert, for the species ID. Anthidium oblongatum is not a native bee, but is introduced, as is the flower on which I caught it, Lotus corniculatus.
Picture
Anthidium oblongatum (Megachilidae) from Ithaca, NY
make a gif using ImageJ and your stack of images:
  1. download Fiji, which is a distribution of ImageJ especially for image processing
  2. make a folder only containing your images (I used tifs)
  3. open the Fiji executable and then go to FILE > Import > Image Sequence; you can just click on one image and click 'open' (you can't select them all, but it will tell you how many images it counts in the folder) --> from here a scrollable window with your images will open
  4. to save, go to FILE > Save As > Animated GIF (scroll down)​
Picture
The 56 images stacked with Zerene Stacker
 Also note:
  • Watch the animation in Fiji by going to: FILE > Image > Stacks > Animation > Start Animation.
  • It's a nicer video to save as an AVI file (but not as easy for the web).
  • My first gif was too large, but I reduced the size of the final file by shrinking the image. Just go to IMAGE > Adjust > Size. I reduced these shown from a width of 2560 pixels to 1500. The final gif was 71MB which is still a big file, but I didn't want the bee to look any fuzzier than it is naturally!
0 Comments

Fossil of oldest flying insect ... or not?

9/23/2017

0 Comments

 
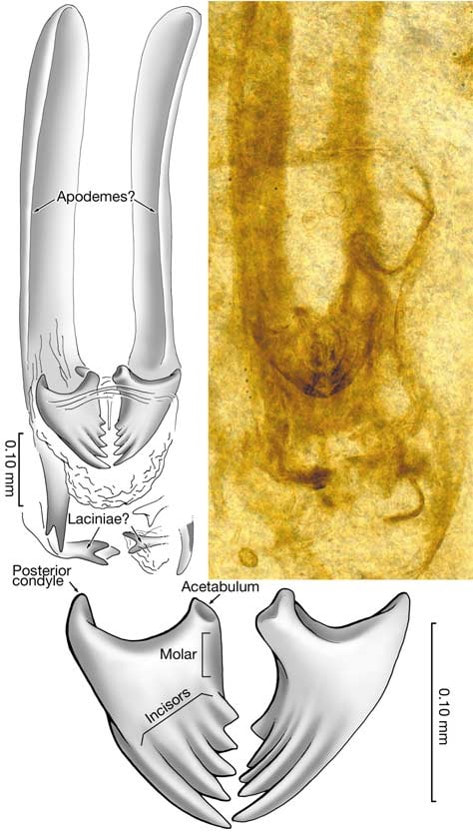
The fossil that was thought to be the oldest flying insect (and has been used to interpret and date the origins of flight) may not even be an insect at all! In an interesting turn, a recent publication asserts that the fossil Rhyniognatha hirsti is not the mandible of a flying insect, but is in fact a fragment of a myriapod: specifically, an immature centipede. 
In an article published May 30, 2017 in the journal PeerJ, Haug & Haug present evidence that the Devonian fossil R. hirsti (>400 My old) is not a flying insect... or an insect... or even closely related to insects... It is a centipede. The fossil is fragmentary, mainly mandibles and some other rather ambiguous parts connected to it. However, the shape of these mandibles was similar to those of dragonflies and neopterans, which prompted Engel and Grimaldi (2004) to tentatively assign it as a fragment of a flying insect. Now, Haug & Haug use 3D imaging and show remains of what they hypothesize is a myriapod-like head capsule. Also, the putative apodemes are deemed to be glands of ectodermal origin. 
Picture
Engel & Grimaldi 2004
Picture
Haug & Haug 2017
The potential misplacement of this fossil has some pretty big implications. The next oldest fossils of flying insects are from the late Carboniferous -- about 80 My after this fossil! That is a huge time difference and affects our interpretation of the origins and evolution of insect flight. Also, many molecular phylogenetic studies have used this as a fossil calibration. For instance, the hexapod dated phylogeny of Misof et al. 2014 incorporated this fossil as a stem calibration for Dicondylia (winged insects + their sister group Diplura), with an age of 411.5 Mya. The reinterpretation of this fossil, if it is accepted, will have wide effects on future work on insect evolution and dating.
As of September 23, there were ~1500 views of the article and no papers citing it, so we'll have to stay tuned for a response!
references:
Engel, M.S. & Grimaldi, D. (2004) New light shed on the oldest insect. Nature  427, 627-630.
​Haug, C. & Haug, J.T. (2017) The presumed oldest flying insect: more likely a myriapod? PeerJ, 5, e3402.
Misof, B., Liu, S., et al. (2014) Phylogenomics resolves the timing and pattern of insect evolution. Science, 346, 763-767.
0 Comments
<<Previous
Forward>>

    PhyloBlog

    Covering topics of phylogenetics and systematics & other science-related news.

    Archives

    October 2019
    June 2019
    March 2019
    November 2018
    October 2018
    September 2018
    December 2017
    November 2017
    October 2017
    September 2017
    August 2017
    July 2017
    June 2017
    May 2017
    April 2017
    March 2017
    February 2017
    January 2017
    December 2016

    Categories

    All
    History & Context
    Programs & Packages
    Taxonomy & Morphology

    RSS Feed

Elizabeth A. Murray, ​PHYLOGENETICS AND EVOLUTION of Hymenoptera

@PhyloSolving  |  e.murray @ wsu.edu
  • home
  • research
    • aculeate UCE project
    • bee viruses
    • eucharitid ant parasitoids
  • publications
  • teaching
  • blog